Create SVG Elements using D3
We had briefly introduced Scalable Vector Graphics (SVG) in our web standards chapter. In this chapter, we will learn about creating SVG elements using D3.
SVG provides different shapes like lines, rectangles, circles, ellipses etc. Hence, designing visualizations with SVG gives you more flexibility and power in what you can achieve.
What is SVG?
- SVG is an image that is text-based.
- SVG is similar in structure to HTML
- SVG sits in the DOM
- SVG properties can be specified as attributes
- SVG should have absolute positions relative to the origin (0, 0)
The full SVG specifications can be found here: SVG specification
The following example demonstrates a rectangle in SVG.
<svg width="500" height="500">
    <rect x="0" y="0" width="200" height="200"></rect>
</svg>
We have an<svg> tag here. Think of SVG as a canvas to paint on (and don't confuse it with HTML <canvas> - that's a different element!). You need to specify a width and height for your canvas. And all your SVG elements like<rect>, <line>, <circle>, <text> would go inside this <svg> tag.
Each SVG element has it's own properties - which includes both geometry and style properties. All properties can be set as attributes but generally, we provide geometry properties as attributes and styling properties as styles. And since SVG sits in the DOM, we can use attr() and append() just like we did for HTML elements.
Let's learn about some of the most used SVG elements in visualizations and how to create and apply styling to them using D3 library.
Line
An SVG line element is represented by <line> tag.
A simple line can be defined as below:
<line x1="100" y1="100" x2="500" y2="100" />A line's attributes are:
- x1: This is the x-coordinate of the first point
- y1: This is the y-coordinate of the first point
- x2: This is the x-coordinate of the second point
- y2: This is the y-coordinate of the second point
<svg width="500" height="500">
    <line x1="100" y1="50" x2="500" y2="50" stroke="black"/>
</svg>
As you can see, we have applied x1, x2, y1 & y2 attributes to line element. Additionally, there's an attribute 'stroke' to specify the line color. This will look like below:
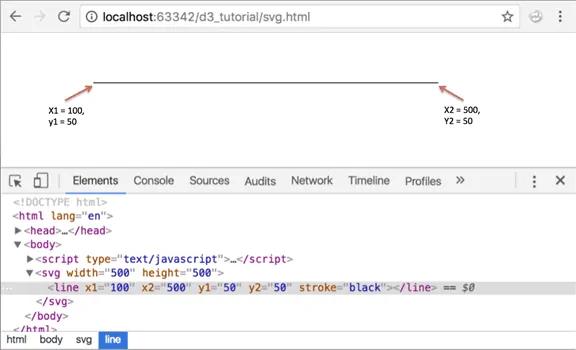
We learned about manipulating DOM elements using D3 in the previous section. Using the same manipulation methods, we can draw the svg line with D3 as shown below.
<body>
<script>
    var width = 500;
    var height = 500;

    //Create SVG element
    var svg = d3.select("body")
    .append("svg")
    .attr("width", width)
    .attr("height", height);

    //Create line element inside SVG
    svg.append("line")
       .attr("x1", 100)
       .attr("x2", 500)
       .attr("y1", 50)
       .attr("y2", 50)
       .attr("stroke", "black")
</script>
</body>
Let's understand the above code.
var width = 500; var height = 500;We create variables for the SVG's width and height. It is good to have them in variables so that you can change them at one place without having to go through the entire code in case you decide to change your SVG's dimensions.
var svg = d3.select("body") .append("svg") .attr("width", width) .attr("height", height);Next, we select the body element and append our SVG element to it and set SVG's width and height. We store the reference of this SVG in a variable called svg, so that we can use it later.
svg.append("line") .attr("x1", 100) .attr("x2", 500) .attr("y1", 50) .attr("y2", 50) .attr("stroke", "black")Then we append a line element to our SVG and provide it with the x1, y1 x2, y2 and stroke attributes using attr() function.
In the example above, we get a straight line without a gradient since we specified the same y-coordinates for both the start and end points.
Using the same line, but using different y-coordinates, we can get a line with a gradient.
<svg width="500" height="500">
    <line x1="100" y1="50" x2="500" y2="250" stroke="black" />
</svg>
Using D3, this can be done as below:
<body>
<script>
    var width = 500;
    var height = 500;

    //Create SVG element
    var svg = d3.select("body")
    .append("svg")
    .attr("width", width)
    .attr("height", height);

    //Create and append line
    svg.append("line")
            .attr("x1", 100)
            .attr("x2", 500)
            .attr("y1", 50)
            .attr("y2", 250)
            .attr("stroke", "black")
</script>
</body>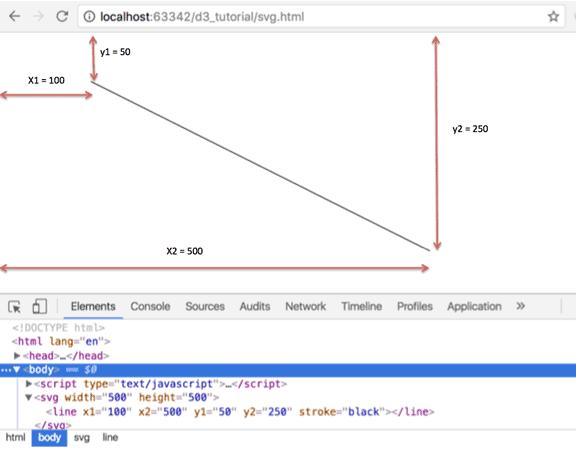
Rectangle
A rectangle is represented by <rect>.
<rect x="0" y="0" width="200" height="200"></rect>Rectangle attributes:
- x: This is the x-coordinate of the top-left corner of the rectangle
- y: This is the y-coordinate of the top-left corner of the rectangle
- width: This denotes the width of the rectangle
- height: This denotes the height of the rectangle
<svg width="500" height="500">
    <rect x="0" y="0" width="200" height="200"></rect>
</svg>
Let's create SVg rectangle with D3 library.
<body>
<script>

    var width = 500;
    var height = 500;

    //Create SVG element
    var svg = d3.select("body")
            .append("svg")
            .attr("width", width)
            .attr("height", height);

    //Create and append rectangle element
    svg.append("rect")
            .attr("x", 0)
            .attr("y", 0)
            .attr("width", 200)
            .attr("height", 100)
</script>
</body>
The output of the above rectangle example is shown below.
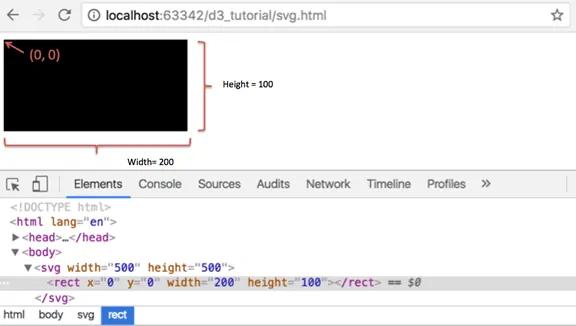
In the above example, after adding the SVG, we appended a rect element svg.append("rect") and specified its x and y coordinates with respect to the origin and also specified the width and height of the rectangle. The default color is black, hence you see a black rectangle drawn on the SVG.
Circle
A circle is represented by <circle> tag.
<circle cx="250" cy="25" r="25"/>Circle attributes:
- cx: This is the x-coordinate of the center of the circle
- cy: This is the y-coordinate of the center of the circle
- r: This denotes the radius of the circle
<svg width="500" height="500">
    <circle cx="250" cy="50" r="50"/>
</svg>
Let's create SVG circle with D3 library.
<body>
<script>
    var width = 500;
    var height = 500;

    //Create SVG element
    var svg = d3.select("body")
                .append("svg")
                .attr("width", width)
                .attr("height", height);

    //Append circle
    svg.append("circle")
       .attr("cx", 250)
       .attr("cy", 50)
       .attr("r", 50)
</script>
</body>
The output of the above circle example is shown below.
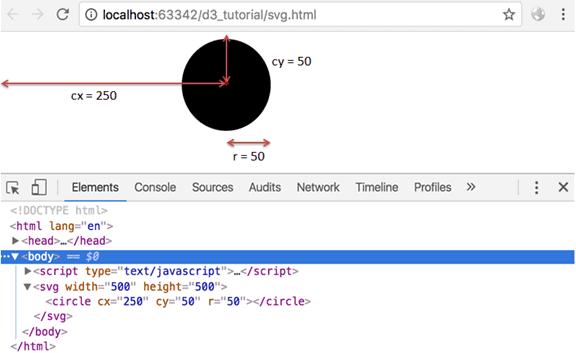
So what we did here was, after adding the SVG, we appended a circle element and specified its attributes; coordinates for the center of the circle (cx & cy) and the radius of the circle (r).
Ellipse
Similar to the <circle> element, we have an SVG element for creating an ellipse. This is represented by <ellipse> tag.
<svg width="500" height="500">
    <ellipse cx="250" cy="25" rx="100" ry="25"/>
</svg>
But, observe the two radii: rx and ry. The ellipse takes two radii.
So an ellipse's attributes are:
- cx: This is the x-coordinate of the center of the circle
- cy: This is the y-coordinate of the center of the circle
- rx: This is the x radius of the circle
- ry: This is the y radius of the circle
Let's create ellipse in D3.
<body>
<script>
    var width = 500;
    var height = 500;

    var svg = d3.select("body")
                .append("svg")
                .attr("width", width)
                .attr("height", height);

    svg.append("ellipse")
       .attr("cx", 250)
       .attr("cy", 50)
       .attr("rx", 150)
       .attr("ry", 50)
</script>
</body>
The output of the above ellipse example is shown below.
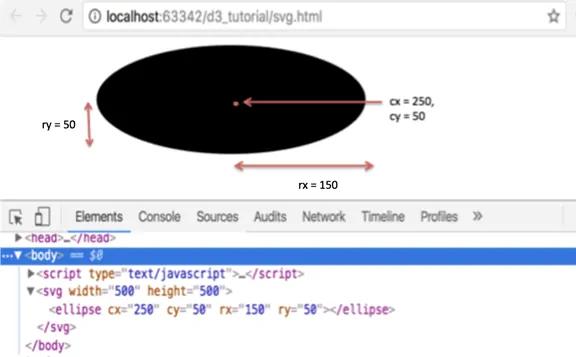
Look at the element we are appending to our SVG, svg.append("ellipse"). Unlike the circle, we have given it two radii, rx and ry.
Text
As we saw in the earlier chapter, SVG has an element to include <text> on the screen.
<svg width="500" height="500">
    <text x="250" y="25">Your text here</text>
</svg>
Let's create text on ellipse using D3 as below.
<body>
<script>
    var width = 500;
    var height = 500;

    //Create SVG element
    var svg = d3.select("body")
                .append("svg")
                .attr("width", width)
                .attr("height", height);

    //Create group element
    var g = svg.append("g")
               .attr("transform", function(d, i) {
                        return "translate(0,0)";
               });

    //Create and append ellipse element into group
    var ellipse = g.append("ellipse")
                   .attr("cx", 250)
                   .attr("cy", 50)
                   .attr("rx", 150)
                   .attr("ry", 50)
                   .append("text")

    //Create and append text element into group
    g.append("text")
     .attr("x", 150)
     .attr("y", 50)
     .attr("stroke", "#fff")
     .text("This is an ellipse!");
</script>
</body>
We have taken the same ellipse example above and added text to the ellipse. You might notice that we have introduced a new<g>group element here.
The<g> element is used when you would like to group certain SVG elements together. In our case, we are using <g> to hold our <ellipse> and <text>elements together. The group element comes in handy for applying transformations so that the transformations are applied to all the child elements of a group.
We have added a stroke attribute to our text so that our text is visible in white over our black ellipse as shown below.

Styling SVG Elements
You may have noticed that we did not specify any color in the above examples. Yet our elements were painted with black color. This is because the default SVG color is black fill with no stroke.
| Style Attribute | Description |
|---|---|
| Fill | This is the fill color for your element. It can be color name, hex value, or RGB or RGBA values. |
| stroke | This is the stroke color. Like our line example above, we can specify a color for our element. |
| stroke-width | Stroke width specifies the width of our line or boundary. This is in pixels. |
| opacity | Opacity will specify an opacity/transparency number. 0 is completely transparent and 1 is completely opaque. |
| font-family | For text elements, we can specify the font-family. This works like CSS. |
| font-size | We can also specify the font-size for text elements. |
All of the above properties can be applied directly or by using CSS.
Let's rewrite our ellipse example and add some more style properties to the ellipse and text elements.
<script>
    var width = 500;
    var height = 500;

    var svg = d3.select("body")
                .append("svg")
                .attr("width", width)
                .attr("height", height);

    var g = svg.append("g")
                .attr("transform", function(d, i) {
                        return "translate(0,0)";
                });

    var ellipse = g.append("ellipse")
                    .attr("cx", 250)
                    .attr("cy", 50)
                    .attr("rx", 150)
                    .attr("ry", 50)
                    .attr("fill", "green")
                    .attr("opacity", 0.5)

    g.append("text")
     .attr("x", 140)
     .attr("y", 50)
     .attr("stroke", "steelblue")
     .attr("font-family", "sans-serif")
     .attr("font-size", "24px")
     .text("I am a pretty ellipse!");
</script>
The output of the above example is shown below.
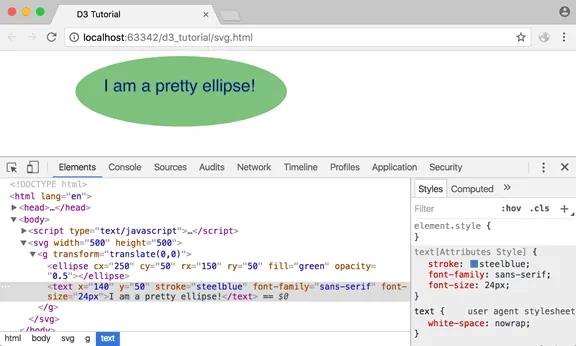
Thus, we can create SVG elements using D3.js. Let's create SVG chart using D3 in the next chapter.